
[InPar]: Auditing the sustainability of the cities through participation
• 1251 Views • No hay comentarios en [InPar]: Auditing the sustainability of the cities through participation Technorati
 Flickr
 del.icio.us
 Ice Rocket
 Wikipedia
by Erin Johnson and Paisaje Transversal

Any good expert knows the importance of appropriate tools to assess and evaluate projects. But this has proven difficult in the field of urbanism, which implicates numerous areas (transportation, environment, culture, etc.) yet which lacks a mechanism for integrating this diversity and transdisciplinarity. Also absent is a means of incorporating stakeholders into these tools. And often, when something isn’t taken into consideration and isn’t valued, it is not part of the equation; the impacts are externalized and dealt with after the fact, likely inflicting damage, distress, and/or additional costs. To this end, our collective has developed Indicadores participativos [InPar], participatory indicators to analyze and understand the myriad components of an urban project, to look at different types of data across various scopes, combining quantitative and qualitative data, tailored to aims of sustainability and community collaboration.
The concepts of sustainability and community collaboration get tossed around a lot, but frequently they are not explained or oversimplified, removing meaning. Sustainability is not just about «being green», community participation is not just about having a town hall forum. They are complex concepts; each encompasses multiple elements and it’s easy to list them individually, but the challenge is that these elements work together in a system with feedback loops and overlapping components. The elements shouldn’t be evaluated individually and independently but rather holistically, as part of a greater whole, to understand the cross-connections.
The concepts of sustainability and community collaboration get tossed around a lot, but frequently they are not explained or oversimplified, removing meaning. Sustainability is not just about «being green», community participation is not just about having a town hall forum. They are complex concepts; each encompasses multiple elements and it’s easy to list them individually, but the challenge is that these elements work together in a system with feedback loops and overlapping components. The elements shouldn’t be evaluated individually and independently but rather holistically, as part of a greater whole, to understand the cross-connections.
Through InPar, we are able to organize and manage quantitative and qualitative information, mapping the relationships between data and measuring the impacts. Sustainability is assessed through categories of:
- Environment - environmental impacts of interventions, status of ecosystems.
- Social – degree of social diversity, complexity, and cohesion, as well as capacity to adapt to changes
- Functional – design efficiency of urban fabric, mobility, infrastructure.
- Economic – diversity and complexity of economic environment, services and resources, capacity for changes.

Each of these categories is further broken down into more explicit sub-categories which are even further broken down into specific tangible quantifiable indicators. For example, the functional category is comprised of urban fabric, mobility, and infrastructure; urban fabric is quantified via indicators of density, compactness, mixed uses, public space, and maintenance. Then, cross-relationships are diagrammed between these indicators and distinct themes derived from urban sectors and services like vegetation, parking, local businesses, and different types of transportation networks. This diagramming provides a sort of urban x-ray and depicts the complexity of assessing sustainability and the interconnections between urban physicality and environmental, social, functional, and economic conditions. In this way we can see that transportation networks and public space and economic activity all have a relationship with the urban fabric and that urban fabric and social diversity and infrastructure and biodiversity all have a relationship with public space.

We have defined the indicators, developed a system of calculation specific to each indicator and an optimal value against which to reference the measurement of the indicator, and a means of diagramming and visualizing the state of the indicator in relation to the optimal value.
Alongside this means of assessing quantitative sustainability indicators we developed a means of measuring qualitative data pertaining to the community inhabitants – perceptions and opinions of residents on aspects of their city or neighborhood. The value of this data lies in categorizing it in order to relate it to the sustainability indicators.

While qualitative sustainability information is collected from various data sources, such as various local and national ministries and agencies and other research institutions, qualitative community data must be collected from the community itself. The focus here is collecting data in a natural way, without asking technical questions or making it difficult for individuals to provide. Means of collecting community information vary based on the specific site or project – What are existing channels and sources of information? How can a diversity of residents be reached? Voluntary participation by residents using existing channels yields the most natural results and shows the existing participatory capacity of the community, but can be supplemented by targeted outreach to collect data from other community members. Although not as natural, targeted data collection begets more representative data, as opposed to the self-selecting voluntary participants. Data is collected both digitally, using apps, social networks, and local forums, and physically, facilitating community groups with participatory tools.
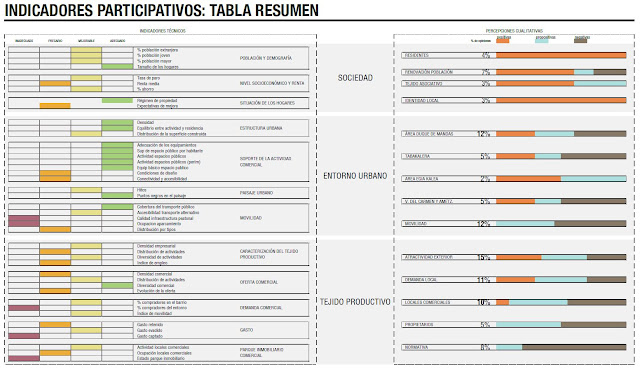
This citizen data is analyzed systematically to glean community perceptions about their locale. Each entry is coded by classifications based on who the entry is from (gender, age group, other community groups), indication on the character of the entry (positive or negative), and the relevant sustainability category. Then entries are coded based on references to components of urban themes. These two pools of data are crossed and compiled into visualizations for each theme with the corresponding data from citizens based on their classification data to communicate community values.
Fusing the quantitative sustainability indicators with the qualitative community data informs proposal prioritization, decision-making, identification of weaknesses, and identification of where more citizen information is needed. InPar can be applied for evaluation of an existing urban environment and for an evolving environment over time to see the real-time impacts of interventions and measure changes. Additionally, the use of InPar enables the more technical sustainability indicators to be translated to something relevant and of interest to the community. And it can serve as an instrument to assess suitability, efficiency and efficacy of projects; as a motor of citizen participation; and as a guarantor of accessibility, transparency, and sustainability in projects and participation.

We are available in English too!
To read more posts in english on Paisaje Transversal blog, follow this link: http://bit.ly/PT_English
To read more posts in english on Paisaje Transversal blog, follow this link: http://bit.ly/PT_English
Image credits:
Image 01: InPar Parque JH (source: Paisaje Transversal)
Image 02: InPar PIER VdB (source: Paisaje Transversal)
Image 03: InPar Mira Qué Lindo (source: Paisaje Transversal)
Image 03: InPar Mira Qué Lindo (source: Paisaje Transversal)
Image 04: InPar Pinto Plan Ciudad (source: Paisaje Transversal)
Image 05: InPar Egia (source: Paisaje Transversal)
Image 06: InPar Olot Més B (source: Paisaje Transversal)
Image 05: InPar Egia (source: Paisaje Transversal)
Image 06: InPar Olot Més B (source: Paisaje Transversal)
Related Posts
About the Author: paisaje transversal
« “La prioridad no es hacer más vías, sino obras para el peatón” – Vanguardia Liberal Museu Municipal de Faro recebe exposição que retrata «marcos de urbanismo» na cidade – Algarve Primeiro »
